Find the mode by counting repeated values
The mode is the value that occurs most often in a dataset. To find it in a short list, count how many times each distinct value appears and compare those frequencies. Do not choose the largest number merely because it looks important. This lesson uses small invented reading-session counts so you can check every observation by hand and explain the answer without relying on a calculator.
Start with five observations
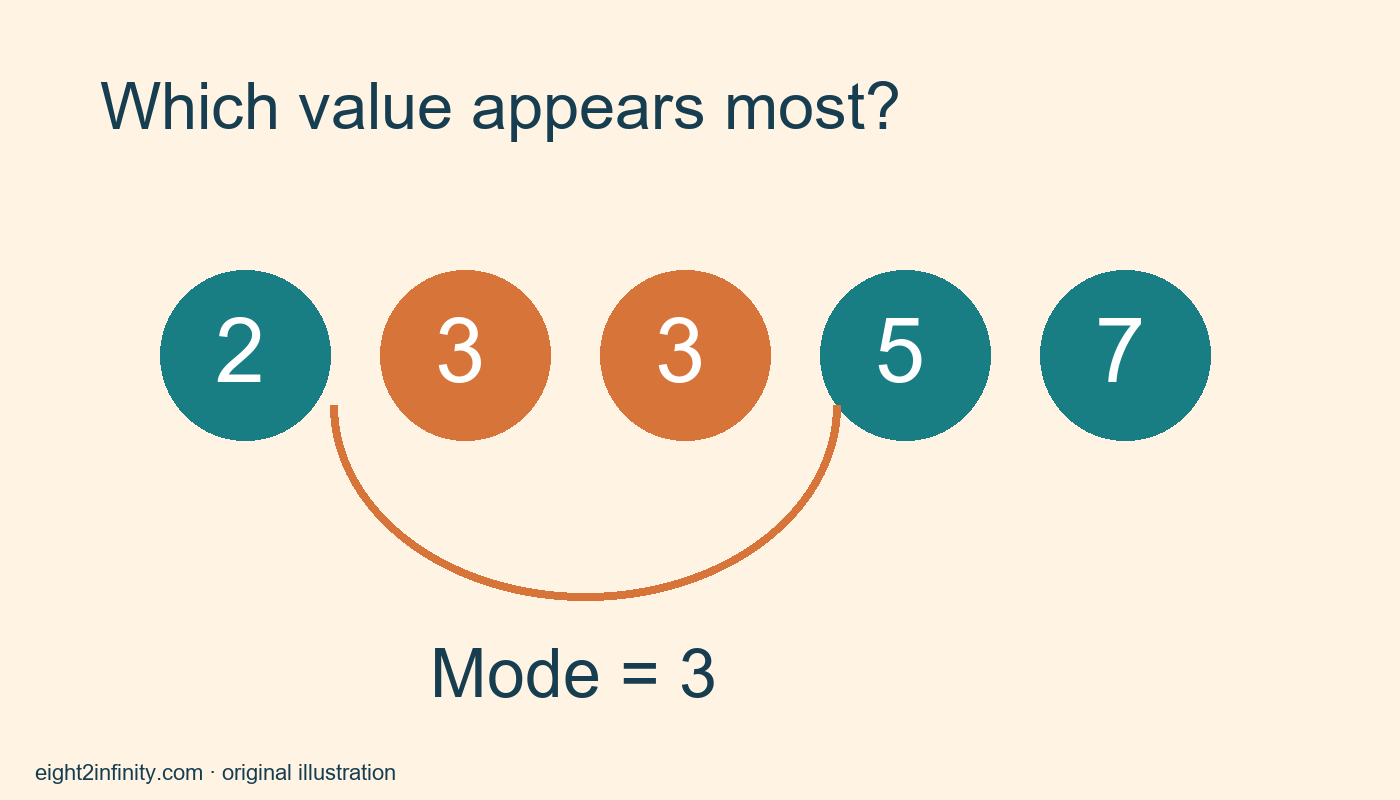
Write the list 2, 3, 3, 5, 7 on paper. Imagine these are numbers of pages read during five separate short practice sessions. The list is a teaching example, not research about actual readers. There are five observations, but only four distinct values because 3 appears twice. Keep the original list visible while counting so a repeated entry is not accidentally treated as one observation.
Create a frequency record beside it: 2 occurs once; 3 occurs twice; 5 occurs once; 7 occurs once. The greatest frequency is two, belonging to the value 3. Therefore the mode is 3 pages. Notice the units in the answer. Two is the number of times the modal value appears; it is not the mode itself. The value and its frequency answer different questions.
Use a physical counting method
Place five small marks on a line, writing one observed value above each mark. Circle both threes in the same color or draw tally marks beside a list of distinct values. This makes repeated observations visible. If you sort the numbers first, preserve every entry, including duplicates. Sorting can help you spot groups, but deleting repetitions would remove exactly the evidence you need to find the mode.
Check your frequency counts by adding them: one plus two plus one plus one equals five. That total must match the number of observations in the original list. If it does not, revisit the entries before choosing the mode. This simple check catches a missed value or a double count. It does not prove that the original data was collected correctly, but it verifies your tally against the list you were given.
Compare the mode with the largest value
The largest observed value is 7 pages, yet it occurs only once. The mode is 3 pages because frequency, not size, determines it. Ask two separate questions: Which session count is largest, and which count appears most often? Giving each question its own answer helps prevent a common mix-up. A number can be large without being common, and a small number can be the most frequent.
The mode also differs from the mean and median. This article does not require calculating those other summaries, but the distinction matters when a question names one specifically. If a worksheet asks for the mode, adding all values and dividing by five answers a different question. Before doing any arithmetic, underline the requested measure and say what it means in ordinary language.
Examine a tied example
Now write 2, 2, 4, 4, 7. Both 2 and 4 occur twice, while 7 occurs once. The dataset has two modes, 2 and 4, because they share the highest frequency. Do not average them to create a new mode of 3. The number 3 does not appear in this list at all. A tie is a real feature of the data, not an error that must be forced into a single answer.
Next consider 1, 2, 4, 6, 8. Every value appears once. In the usual introductory classroom convention, this list has no mode because no value occurs more frequently than the others. Follow your course's stated convention when reporting such a case, since descriptions of all-frequency ties can vary. Write the frequencies explicitly so your reasoning remains clear even when terminology differs.
Describe what the result can and cannot tell you
A mode of 3 pages describes the most frequently observed count in this tiny example. It does not prove that most sessions had three pages: only two of the five did. Most frequent and more than half are different ideas. Likewise, the mode does not predict exactly how many pages the next session will contain. It summarizes the observations already in the list.
The mode can also summarize categories, such as the most frequently selected notebook color. In that case there is no need to add the category names or put them on a numeric scale. Count each category consistently and compare the frequencies. Keep spelling variations under control so Blue and blue do not accidentally become separate groups when they are intended to describe the same option.
Practice with a changed observation
Return to 2, 3, 3, 5, 7 and replace 7 with 5. The new list is 2, 3, 3, 5, 5. Explain why the answer now includes two modes. Then create your own six-observation list with exactly one mode and check it using a frequency tally. Make sure your frequency total is six. What would you say to a classmate who chose the largest value instead of counting how often each value appears?Label the original list as observations and the tally as frequencies. These two headings help another learner follow your work without confusing the recorded values with the number of times each one occurred.