Read a bar graph whose scale counts in twos
Read the numbered axis before counting intervals on a bar graph. If the marks are 0, 2, 4, 6, and so on, each interval represents two units. A bar reaching the third interval above zero represents six, not three. Use the graph title and axis label to identify what those units mean. This small habit prevents a common mistake: counting grid spaces correctly while assigning the wrong value to each space.
Draw a graph with a deliberate scale
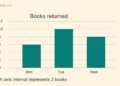
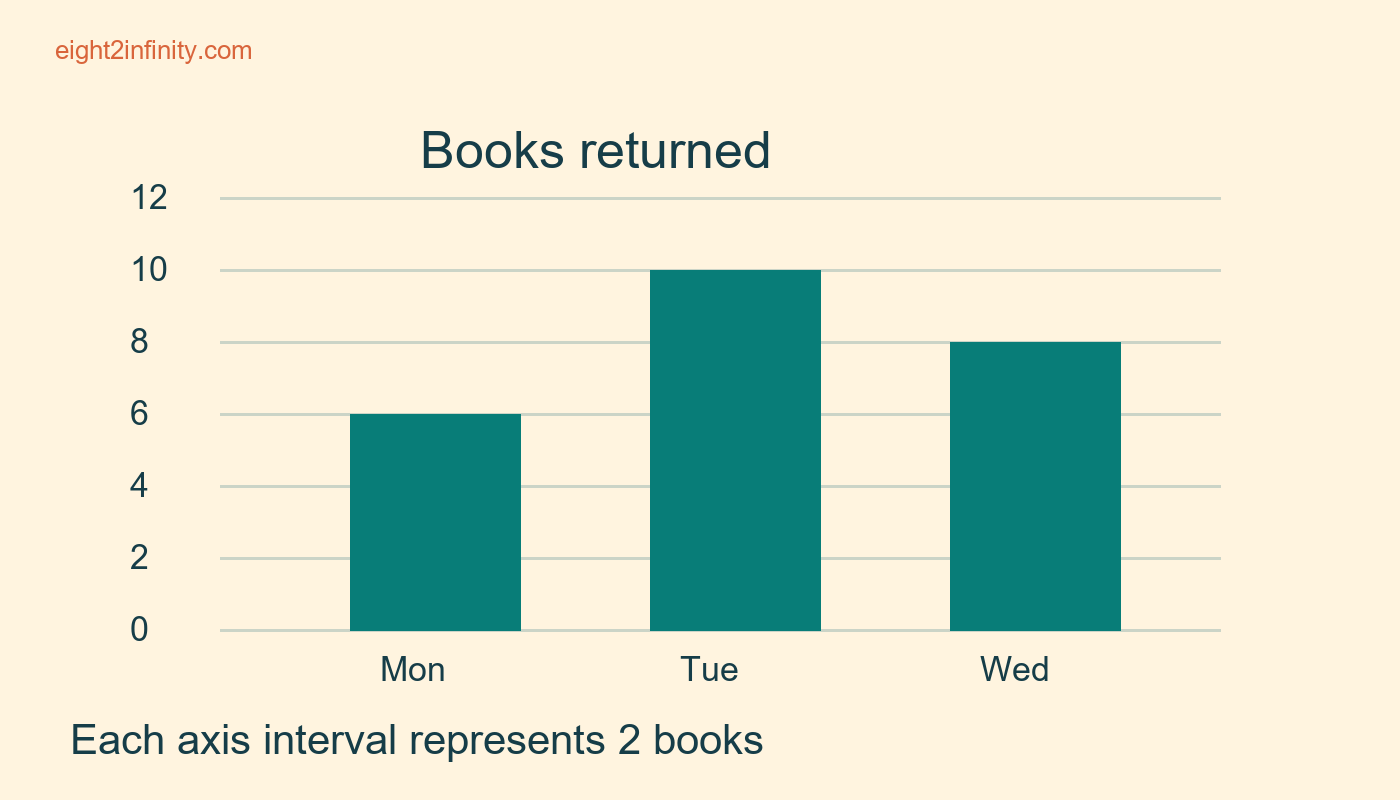
On squared paper, draw a horizontal category axis and a vertical value axis. Label the vertical axis Books returned. Mark the value axis from 0 through 12 in steps of 2, using equal physical spacing between the numbers. Along the category axis, write Monday, Tuesday, and Wednesday. Give the graph the title Books returned to a class shelf. These are invented counts for a reading exercise, not reported school data or a claim about reading behavior.
Draw Monday's bar to 6, Tuesday's to 10, and Wednesday's to 8. Keep the bars the same width with clear gaps between them. Use a ruler if it helps you align the tops with the numbered marks. The baseline should represent zero in this example. Avoid three dimensional effects or decorative shapes, because you want the relationship between bar height and numerical scale to be easy to inspect without interpreting perspective.
Translate one bar step by step
Start at Monday's bar and move horizontally from its top to the numbered value axis. You should reach 6. Now count the intervals from zero to that height: there are three. Explain the relationship as Three intervals times two books per interval equals six books. Both descriptions are correct, but only the second one connects the physical spaces to the quantity. A learner who says Three because there are three squares has omitted the scale factor.
Read Tuesday and Wednesday in the same way. Tuesday reaches 10, or five intervals of two books. Wednesday reaches 8, or four intervals of two books. Say the unit each time. Five intervals and five books are different statements. Writing the phrase books returned beside your answers helps keep the numerical result connected to the question. The graph is about a count of returned books, not the number of children or the time spent reading them.
Compare bars using the same units
Which day had more returns, Tuesday or Monday? Tuesday's 10 exceeds Monday's 6 by 4 books. You can subtract the values directly or notice that the bars differ by two intervals and multiply two by two. Both methods should produce the same answer. A difference of two grid spaces does not mean two books on this graph. This is a useful place to check whether someone has remembered the scale while moving from reading values to comparing them.
Find the total for the three days: 6 plus 10 plus 8 equals 24 books. The highest bar is 10, while the total is 24; these answer different questions. A graph's visual height does not directly display every derived quantity you may be asked to calculate. Write down the values before combining them. If you use the graph to answer a new question, first decide which categories belong in that question and which operation connects them.
Redraw the same data with another scale
On a second graph, label the value axis in ones from 0 to 12. Plot the same three counts. The data have not changed, even though you now count six one unit intervals for Monday rather than three two unit intervals. Compare the labels and heights carefully. If the physical spacing of each interval stays the same, the drawing takes more vertical room, which explains why an author might choose a scale that counts in twos.
Do not compare raw physical bar heights across unrelated graphs without inspecting their scales. One page may use a different interval, a different drawing height, or a different baseline. In this exercise both graphs start at zero, so the comparison remains simple. In real material, look for breaks or a baseline above zero and explain how they affect the visual impression. If labels are missing, say that the numerical values cannot be read reliably rather than guessing a convenient scale.
Diagnose reading mistakes
If an answer says Tuesday equals 5, ask whether the learner counted intervals or read the numbered axis. If it says Wednesday equals 10, check whether the eye followed the correct grid line from the bar top. A ruler or a strip of paper can help track horizontally without changing the graph. If the bars fall between labeled marks, examine any smaller subdivisions before assigning an exact value. Do not assume every unlabeled space has the same meaning across all graphs.
Keep categories and units distinct. Monday is a category label; Books returned describes the measured count. The graph does not show how many books remain on the shelf or how many were borrowed unless that information is separately supplied. Reading what is present and recognizing what is absent are equally useful skills. A correct arithmetic answer can still be inappropriate if it answers a question the graph never contained enough information to resolve.
Create a question for someone else
Ask a reader to find Wednesday's count, the difference between Tuesday and Wednesday, and the three day total. The answers should be 8 books, 2 books, and 24 books. Then change the axis to steps of 5 and choose new values that land on its labeled marks. Can the reader explain the new interval before answering? A good explanation identifies the scale, reads the relevant bars, and keeps the unit attached to each result.